Everything You Need to Know About Managing a Chart of Accounts in 2025

Do you need help with managing your business finances? A Chart of Accounts can help. It's a crucial tool that provides a standardized framework for organizing and recording financial transactions, making it easier to generate accurate financial statements and reports.
Research shows that over 45% of small businesses close their doors within the first five years of operation, with financial mismanagement being one of the most common culprits. Effectively managing your finances is essential to realize success and keep your business afloat.
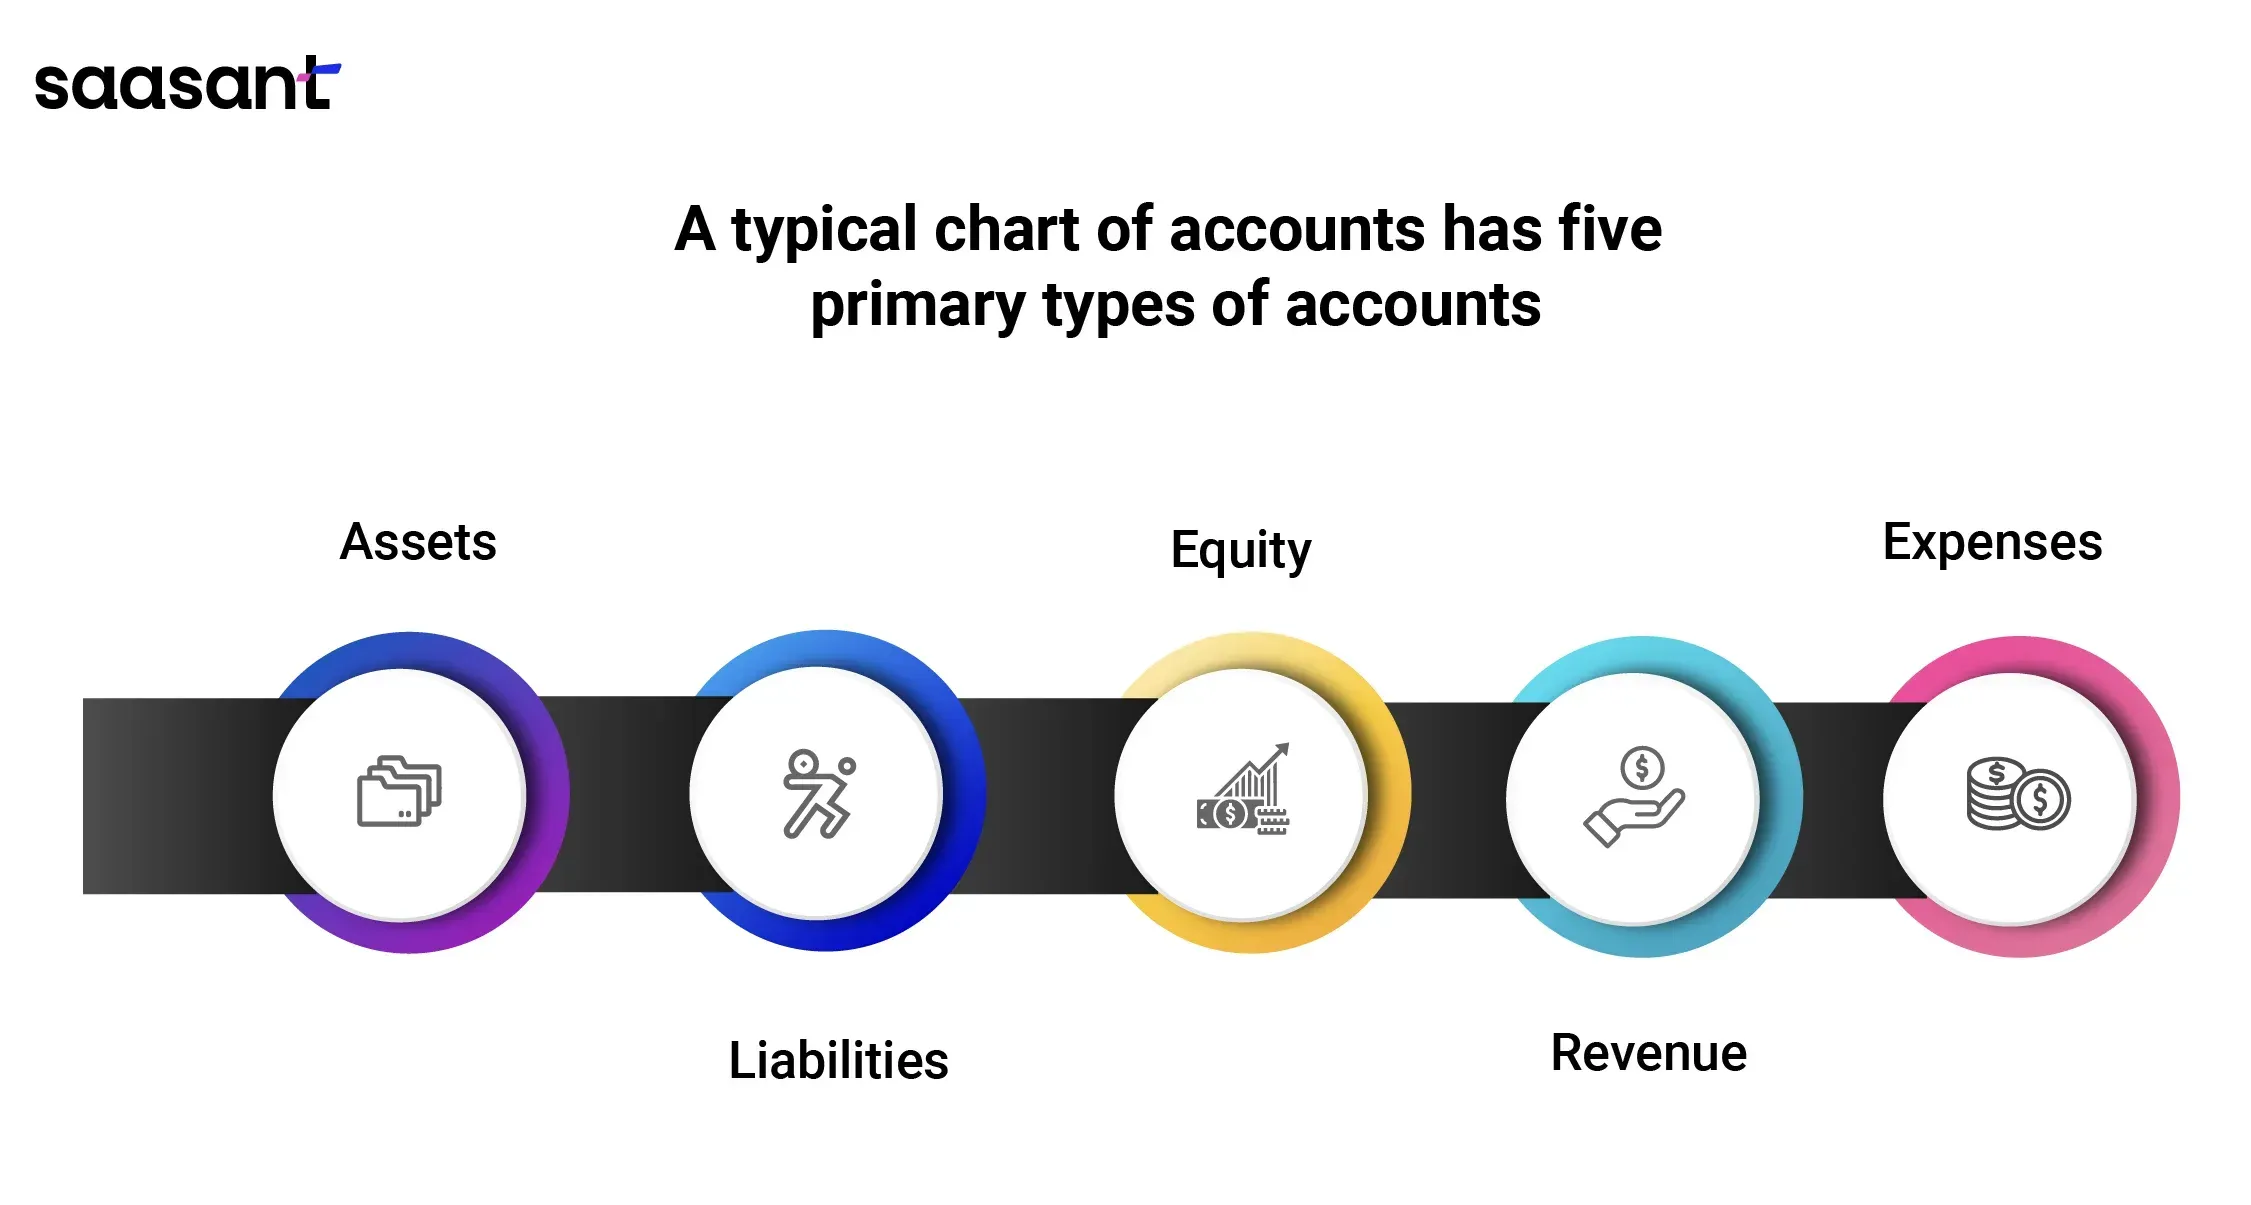
One of the most critical tools that all small businesses should have in their financial management arsenal is a Chart of Accounts. It categorizes accounts by type, including expenses, assets, equity, liabilities, and revenue.
This organization makes it simpler to track deductible expenses, identify areas for potential tax savings, and prevent legal issues. Despite its benefits, only 64.4% of small businesses in the US use accounting software, which plays a vital role in creating and managing a chart of accounts.
This article covers everything you need to know about charts of accounts, including structure, types, and effective management strategies. Make sure to let financial management be a hurdle in your business; implement a Chart of Accounts today.
Contents
Definition and Purpose of Chart of Accounts
Structure and Types of Chart of Accounts
Managing Chart of Accounts in QuickBooks
Understanding Chart of Accounts in Bookkeeping
Final Thoughts
FAQs
Definition and Purpose of Chart of Accounts
What is a Chart of Accounts?
The Chart of Accounts serves as a comprehensive list of all accounts utilized in a business's accounting system, offering a structured framework for organizing financial transactions and monitoring the flow of funds within the company. Each account is designated with a distinct number, name, and description, facilitating easy identification, categorization, and reporting of financial information.
This organizational feature typically encompasses balance sheet accounts, income statement accounts, and other accounts tailored to the specific requirements of the business. In essence, the Chart of Accounts is a foundational element in accounting that enhances clarity and efficiency in managing a company's financial records.
Balance sheet accounts represent the business's assets, liabilities, and equity, while income statement accounts represent revenue, expenses, and gains or losses.
Importance of Chart of Accounts
The Chart of Accounts is an essential tool for businesses and organizations. Find below some of the reasons why it is crucial to have a Chart of Accounts include:
1. Accurate financial reporting: The Chart of Accounts is the foundation for financial reporting. It provides a clear and organized way of recording all financial transactions and makes it easier to generate accurate financial reports, including balance sheets, income statements, and cash flow statements.
2. Better decision-making: By having a detailed breakdown of all their income and expenses, businesses can identify areas where they can cut costs, increase revenue, or invest in new opportunities.
It, in turn, helps them to make informed decisions that can positively impact their bottom line.
3. Compliance: The chart of Accounts ensures that all financial transactions are correctly classified and recorded, making it easier to comply with regulatory requirements and financial reporting standards.
4. Improved communication: The Chart of Accounts helps improve communication between organizational departments.
By having a common language for financial transactions, the finance team can easily communicate financial information to other departments, enabling them to make better-informed decisions.
5. Audit trail: The Chart of Accounts also provides an audit trail for all financial transactions. Businesses can quickly identify and investigate any discrepancies in their financial statements, enabling them to take corrective action before severe damage occurs.
Structure and Types of Chart of Accounts
Standard Chart of Accounts
A standard Chart of Accounts is a set of commonly used account categories or classifications organized into a list. It is the foundation of the accounting system for most businesses and organizations, and it provides a consistent way to organize and track financial transactions.
Types of Accounts Used in a Chart of Accounts
In addition to the standard Chart of Accounts categories, businesses commonly use other account types in a Chart of Accounts. These include:
1. Control accounts: These are summary-level accounts used to consolidate and summarize transactions for a group of related accounts. Examples include accounts receivable control and accounts payable control.
2. Subsidiary accounts: These are detailed-level accounts that track individual transactions. Examples include individual customer accounts and vendor accounts.
3. Nominal accounts: Record revenue, expenses, gains, and losses. Examples include sales revenue, salary expenses, and interest income.
Petty cash is a nominal account for recording small expenses paid out in cash. Businesses typically use petty cash accounts for small purchases like office supplies, postage, and minor repairs.
Chart of Accounts Numbering
Chart of Accounts numbering is a system that assigns unique codes or numbers to each account in a Chart of Accounts. The numbering system is essential because it provides a consistent and structured way to identify and track each account. There are two standard numbering systems:
1. Sequential numbering: This system assigns a unique number sequentially to each account. For example, the system might assign 100 to the first account, 101 to the second account, etc.
2. Hierarchical numbering: This system uses a series of digits to represent different levels of accounts. For example, the first digit might represent the category (such as assets or liabilities), the second digit might represent the subcategory (such as cash or accounts payable), and so on.
Chart of Accounts Template
A Chart of Accounts template is a pre-designed document that offers a framework for organizing financial data and serves as a starting point for creating a customized Chart of Accounts.
It can save time and effort in setting up a new accounting system and ensures consistency in account classification across different accounting periods. Some of the key benefits of using a Chart of Accounts template include:
Ease of use: A Chart of Accounts template provides a standardized and structured format that makes it easy for businesses to create and manage their financial records.
Improved accuracy: Businesses can ensure that all accounts are appropriately classified and that financial data is accurately recorded and reported.
Time-saving: A template can save businesses significant time setting up their accounting system, reducing the risk of errors and omissions.
Most accounting software packages offer a pre-designed chart of account templates that businesses can customize to suit their needs. Alternatively, companies can use online resources to find templates that meet their requirements.
Sample Chart of Accounts
A sample Chart of Accounts is a model or example businesses can use as a reference or guide when setting up a new accounting system. It typically includes a list of accounts and subcategories along with their numerical codes.
A sample Chart of Accounts clearly explains how accounts should be classified and reported in a given industry or business.
Using a sample Chart of Accounts can help businesses to:
Ensure consistency in financial reporting: A sample Chart of Accounts can ensure that accounts are classified and reported consistently across different accounting periods.
Save time: Businesses can set up their accounting system and avoid the risk of errors and omissions.
Meet regulatory requirements: Many industries have specific reporting requirements. Businesses can ensure they meet these requirements using a sample Chart of Accounts tailored to the industry.
Best Chart of Accounts Structure
The best Chart of Accounts structure depends on the company's specific needs. Tailor a well-designed Chart of Accounts to the company's size, industry, and reporting requirements.
It should also be flexible enough to accommodate changes as the company grows and evolves. Some key considerations when designing a Chart of Accounts include:
Industry-specific requirements: Consider different industry reporting requirements when designing a Chart of Accounts.
Company size: The size of a company will determine the level of detail required in the Chart of Accounts. Larger companies may require more detailed accounts to track financial transactions accurately.
Reporting requirements: Companies must also consider the reporting requirements of stakeholders, such as investors, lenders, and regulatory bodies.
In general, a well-designed Chart of Accounts should be:
Organized: Organize accounts logically to facilitate efficient financial reporting and analysis.
Comprehensive: All financial transactions should be appropriately recorded and classified.
Consistent: Accounts should be classified and reported consistently across different accounting periods.
Adaptable: The Chart of Accounts should be flexible enough to accommodate changes as the company grows and evolves.
List of Accounts Used by a Business
Every business needs to keep track of its financial transactions and performance. Businesses achieve this by using a system of accounts that categorizes and records all the money flows in and out of the company. The chart of accounts organizes these accounts, listing all the financial accounts in a company's financial statements.
Each type of account has a different role and effect on the financial statements. Let’s look at each type of account in more detail.
Assets
Assets are valuable resources a business owns or controls and are expected to generate future economic benefits. These assets can take various forms, including tangible or intangible, current or non-current, and businesses may categorize them as operating or non-operating.
The balance sheet reports assets, classifying them by their liquidity, which indicates the ease of cash conversion. Businesses expect to use or consume current assets within one year or the normal operating cycle, whichever is longer. Companies expect non-current assets to last longer than one year or the company's standard operating cycle.
Liabilities
Liabilities represent a business's financial obligations to external entities from past transactions or events. These obligations can be categorized as current or non-current, operating or non-operating. Let's delve into a few examples:
Current Liabilities:
Accounts Payable: Short-term obligations to suppliers or creditors.
Notes Payable: Short-term loans requiring repayment.
Wages Payable: Amounts owed to employees for work performed.
Taxes Payable: Unsettled tax obligations, typically short-term.
Non-Current Liabilities:
Bonds Payable: Long-term debt securities issued by the business.
Organizing Liabilities on the Balance Sheet
On the balance sheet, liabilities are strategically categorized based on their maturity, reflecting the timeline for settlement. This crucial classification aids in providing a comprehensive financial snapshot. Let's break it down:
Current Liabilities
Businesses anticipate resolving liabilities within one year or the standard operating cycle, whichever is longer.
Examples: Accounts payable, notes payable, wages payable, and taxes payable fall into this category.
Implication: These are the short-term financial obligations demanding attention within the immediate fiscal horizon.
Non-Current Liabilities
Liabilities have an expected settlement timeline extending beyond one year or the normal operating cycle.
Examples: Bonds payable and other long-term debts fall under non-current liabilities.
Implication: These represent the extended financial commitments that demand little attention and play a role in long-term financial planning.
Equity
Equity is the residual claim on a company's net assets, often called shareholders’ equity, owners’ equity, or net worth. This financial term comprises two primary elements, shedding light on the ownership structure:
Contributed Capital
Definition: The sum of money invested by the owners into the business.
Role: Represents the initial and subsequent financial contributions made by stakeholders.
Retained Earnings
Definition: The cumulative profits or losses a business has amassed over time, yet not distributed to owners as dividends.
Role: Reflects the retained portion of generated profits, contributing to the overall financial strength.
Equity is more than a numerical figure; it encapsulates business owners' shared interests and financial standing. The synergy between contributed capital and retained earnings showcases the dynamic nature of ownership in business finance.
Equity on the Balance Sheet
Equity, an integral element in financial reporting, is on the balance sheet, symbolizing the gap between total assets and liabilities. This crucial distinction provides a snapshot of the business's net worth. Let's explore further:
Dynamic Nature of Equity
Definition: The financial representation of the owners' residual interest in the business.
Calculation: Derived by subtracting total liabilities from total assets.
Impact on Business Performance:
Fluctuations: Equity is not static; it can increase or decrease based on the business's activities and performance.
Profit Influence: Business profitability results in equity growth.
Dividend Effect: The distribution of dividends diminishes equity.
Understanding the ebb and flow of equity is vital for stakeholders, as it mirrors the business's financial health and reflects the outcomes of its operational endeavors. This dynamic interplay between assets, liabilities, and equity unveils the intricate financial narrative within a balance sheet.
What is a Chart of Accounts example?
A Chart of Accounts example typically includes a list of account names and numbers representing various financial transactions of a business. Here is an example of a Chart of Accounts for a small retail business:
What is in a Chart of Accounts?
A Chart of Accounts typically includes a list of accounts, subcategories, and numerical codes. Each account is assigned a unique code, allowing easy identification and tracking of financial transactions. The accounts in a Chart of Accounts are classified into five categories:
1. Assets: These are resources owned by a business or organization. Examples include cash, accounts receivable, inventory, and property.
2. Liabilities: This category includes accounts that represent the debts or obligations of a business or organization. Examples include accounts payable, loans, and taxes owed.
3. Equity: This includes accounts representing the residual value of a business or organization after paying off all liabilities. Examples include owner's equity, retained earnings, and contributed capital.
4. Revenue: It represents the income earned by a business or organization. Examples include sales revenue, service revenue, and interest income.
5. Expenses: They represent the costs incurred by a business or organization to generate revenue. Examples include rent, utilities, salaries, and advertising expenses.
How do you categorize accounts in a Chart of Accounts?
Accounts in a Chart of Accounts are typically categorized according to their nature and function. The nature of an account refers to the type of transaction it records, while the function relates to the purpose of the account.
Some common ways to categorize accounts in a Chart of Accounts include:
Graphic for the categories and sub-categories
1. Balance sheet accounts:
Assets: Cash, accounts receivable, inventory, prepaid expenses, property, plant, and equipment.
Liabilities: Accounts payable, loans payable, accrued expenses, deferred revenue, and long-term debt.
Equity: Common stock, retained earnings, and dividends.
2. Income statement accounts:
Revenue: Sales, interest income, and rental income.
Cost of goods sold: Direct costs associated with producing and delivering products or services, such as materials and labor.
Operating expenses: Indirect costs associated with running the business, such as rent, utilities, salaries, and advertising.
Other income and expenses: Gains or losses on the sale of assets, interest expense, and taxes.
3. Subsidiary accounts:
Accounts receivable: Customers who owe money to the business.
Inventory: Goods or materials held for sale or use in production.
Accounts payable: Amounts owed to suppliers for goods or services.
Prepaid expenses: Expenses paid in advance, such as insurance or rent.
These categories are not exhaustive, and the specific accounts and subcategories used in a Chart of Accounts can vary depending on the company's industry, size, and reporting requirements.
However, a well-designed Chart of Accounts should provide a clear and comprehensive overview of the company's financial structure and enable accurate financial reporting.
GL vs. Chart of Accounts
The general ledger (GL) and Chart of Accounts are closely related but serve different purposes. The GL records all financial transactions in a company, while the Chart of Accounts is a framework for organizing those transactions.
The GL provides a more detailed record of each transaction, including the date, amount, and accounts involved, while the Chart of Accounts provides a high-level overview of the accounts used in the GL.
Here is a table that summarizes the differences between the general ledger and Chart of Accounts:
Chart of Accounts for Non-profit
A Chart of Accounts is a crucial financial tool for any organization, including non-profit organizations. Unlike for-profit companies, non-profits have different revenue and expense streams. Therefore, their Chart of Accounts will have accounts and subcategories unique to their operations.
Some common accounts in a non-profit Chart of Accounts include:
1. Contributions: This account records donations or grants the non-profit receives. Donations are a significant source of revenue for nonprofits, and this account helps track the contributions received.
2. Program expenses: This account records costs related to the non-profit's programs or services. Nonprofits exist to serve a particular cause, and their programs or services are central to achieving their mission.
3. Fundraising expenses: Fundraising is essential for non-profits, as it helps them generate revenue to fund their operations. However, fundraising can incur expenses like event planning, advertising, and marketing.
4. Administrative expenses: This account records costs related to the non-profit's overhead, such as salaries and rent. Like any organization, nonprofits incur expenses to keep their operations running. These expenses include salaries, rent, utilities, and other administrative costs.
It is important to note that each non-profit organization may have additional accounts or subcategories in their Chart of Accounts that reflect their unique operations. For example, a non-profit that operates a thrift store may have an account for sales revenue and cost of goods sold.
A proper Chart of Accounts for a non-profit organization can provide a clear picture of its financial health, making monitoring and controlling its expenses and revenues easier. With accurate financial data, non-profit organizations can make informed decisions about their operations, fundraise effectively, and achieve their missions.
Chart of Accounts for Restaurants
A Chart of Accounts for a restaurant may include accounts specific to the industry, such as food and beverage costs and labor costs. Some common accounts in a restaurant Chart of Accounts include:
Graphic to cover all categories and sub-categories
1. Sales and revenue accounts:
Food and beverage sales: This account records the revenue from selling food and beverages to customers.
Catering sales: This account records the revenue earned from catering events.
Bar sales: This account records the revenue earned from selling alcoholic beverages.
Gift card sales: This account records the revenue earned from selling gift cards.
2. Cost of goods sold accounts:
Food costs: This account records the cost of ingredients and supplies used to prepare food.
Beverage costs: This account records the cost of ingredients and supplies used to make beverages.
Cost of paper products: This account records the cost of paper products like napkins and plates.
Cost of disposables: This account records the cost of disposable items like straws and utensils.
3. Operating expense accounts:
Labor costs: This account records the wages and salaries paid to employees.
Rent expense: This account records the cost of renting the restaurant space.
Utilities: This account records the cost of utilities like water, gas, and electricity.
Marketing and advertising expenses: This account records the cost of advertising and marketing the restaurant.
4. Other accounts:
Tips payable: This account records the tips employees earn to be paid.
Depreciation expense: This account records the decrease in value of assets like equipment and furniture over time.
Bank charges: This account records the fees banks charge for services like processing credit card transactions.
These are just a few examples of the accounts a restaurant could include in its Chart of Accounts. The specific accounts and subcategories will vary depending on the restaurant's size, type, and particular needs.
Managing Chart of Accounts in QuickBooks
How to create a Chart of Accounts
Creating a Chart of Accounts is essential in setting up your accounting system. It allows you to organize your financial transactions. Here are the steps involved in creating a Chart of Accounts or adding an account to it in QuickBooks Online:
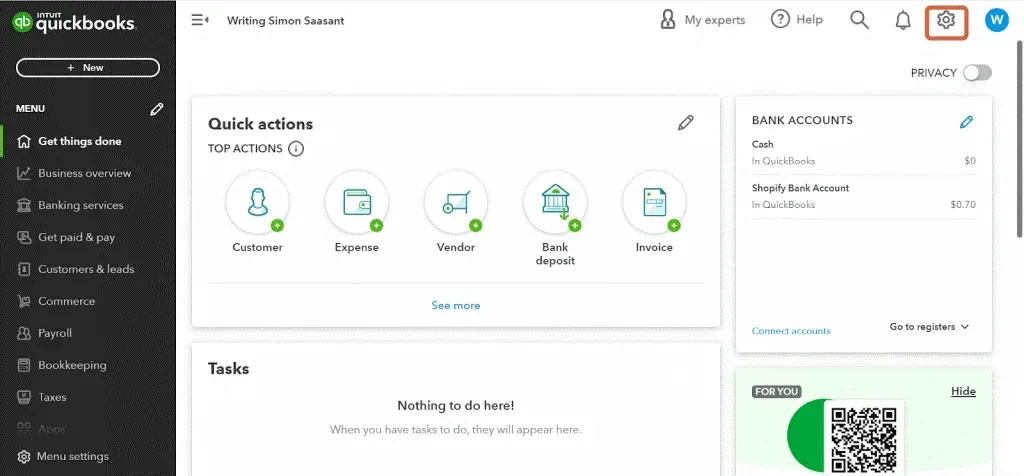
Log in to QuickBooks Online and select the Gear icon on the top right corner.
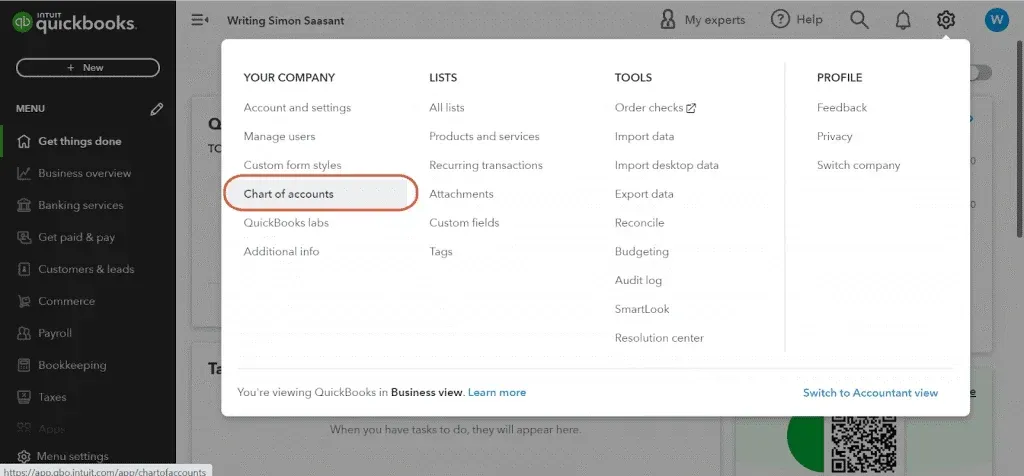
Select "Chart of Accounts" under the "Your Company" section.
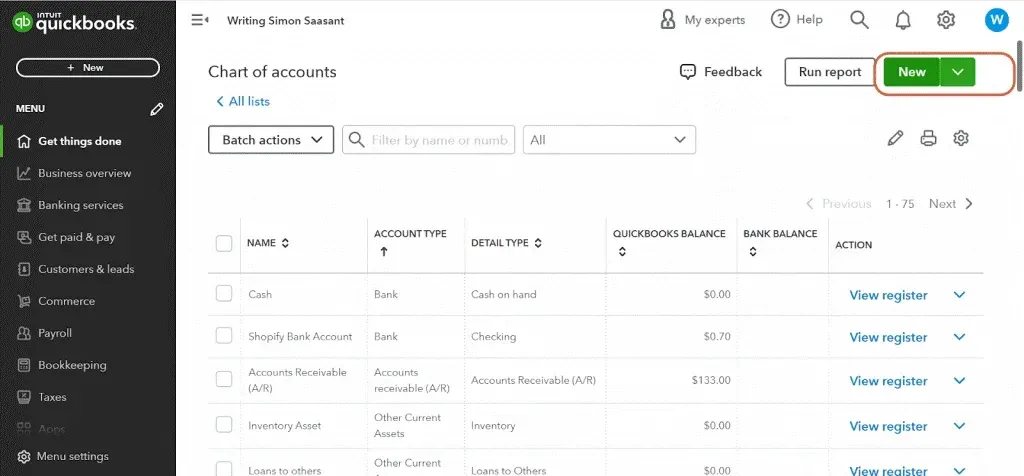
Click the "New" button in the top right corner.
Select the account type from the dropdown list, such as bank, credit card, expense, or income.
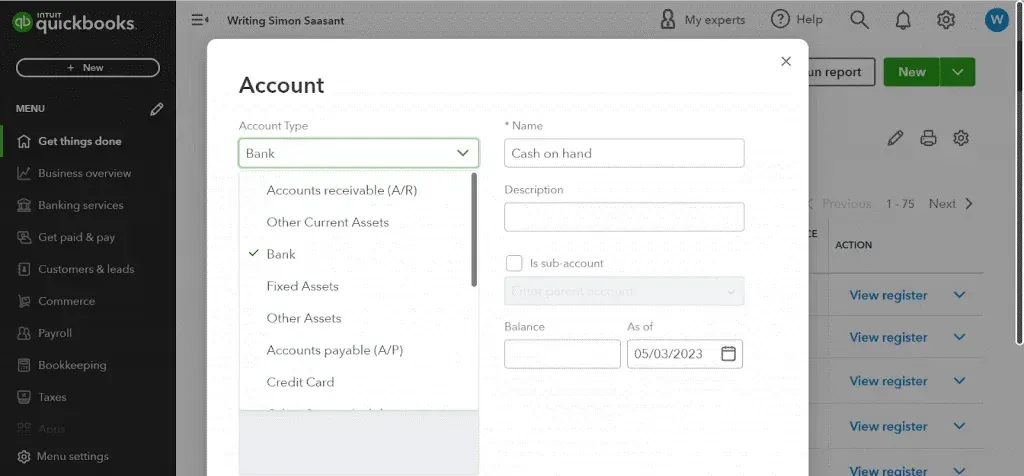
Fill in the required information, such as account name and number, and click "Save and Close" or "Save and New" to add another account.

How to edit a Chart of Accounts in QuickBooks Online
Your Chart of Accounts may also need to change as your business evolves. Below are the steps involved in editing a Chart of Accounts in QuickBooks Online:
Log in to QuickBooks Online and select the Gear icon on the top right corner.
Select "Chart of Accounts" under the "Your Company" section.
Find and select the account you want to edit and click the "Edit" button on the right.
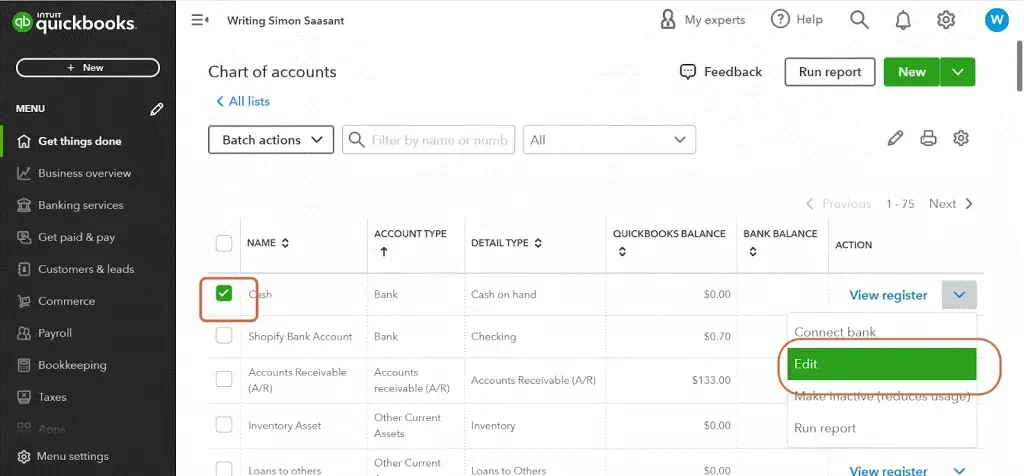
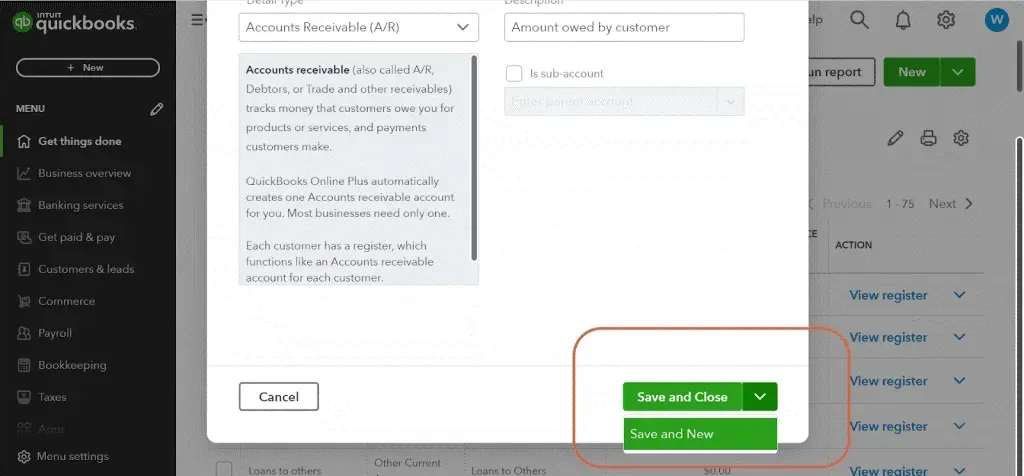
Make the necessary changes to the account, such as account name or number, and click "Save and Close" or "Save and New" to continue editing.
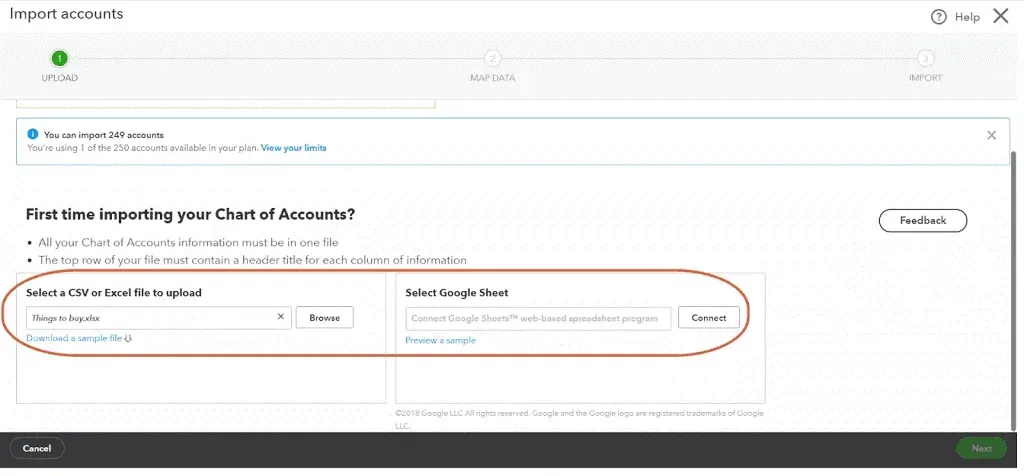
How to import a Chart of Accounts in QuickBooks
You can easily import it into QuickBooks from another accounting software or file. Here’s how to go about it:
Log in to QuickBooks Online and select the Gear icon on the top right corner.
Select "Chart of Accounts" under the "Your Company" section.
Click the "Import" button in the top right corner.
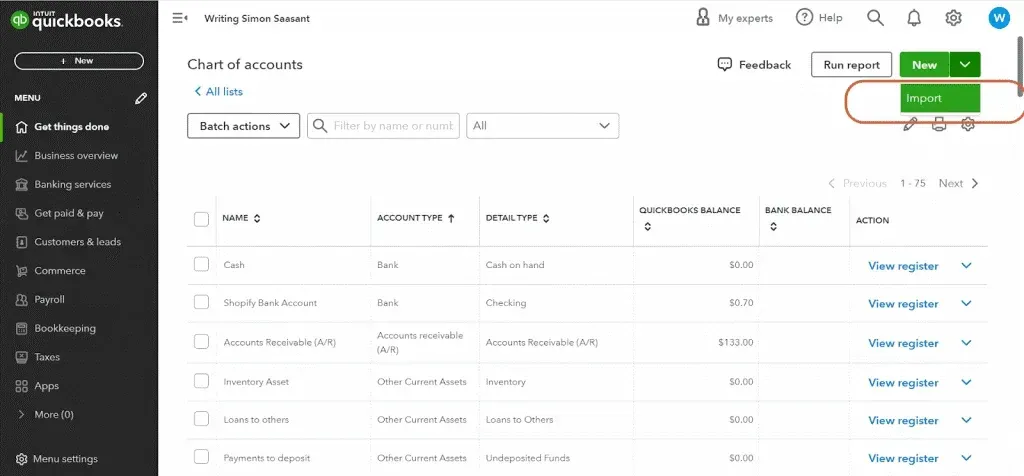
Follow the prompts to select and upload a CSV file containing the Chart of Accounts data.
Enhance your QuickBooks efficiency with SaasAnt Transactions – effortlessly import and manage transactions in bulk through various formats such as CSV, Excel, PDF, or IIF, simplifying your financial processes.
How to merge two Chart of Accounts in QuickBooks
If you have duplicate or similar accounts in your Chart of Accounts, you may want to merge them to streamline your accounting system. The steps below will guide you through merging two charts of accounts in QuickBooks.
Log in to QuickBooks Online and select the Gear icon on the top right corner.
Select "Chart of Accounts" under the "Your Company" section.
Find the accounts you want to merge and note their names and numbers.
Rename one of the accounts to match the other.
Select the account you want to merge and click the "Edit" button on the right.
Change the account type to match the other account.
Delete the other account by selecting it and clicking the "Delete" button.
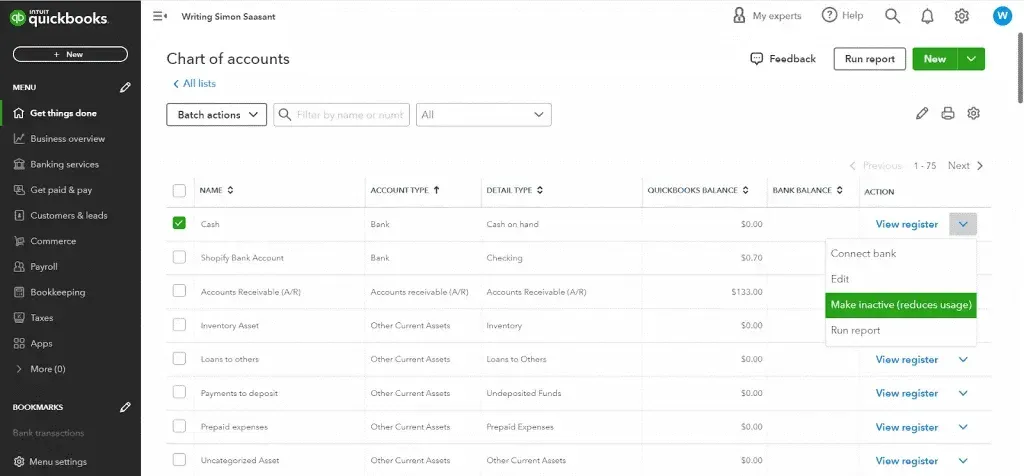
How to clean up a Chart of Accounts in QuickBooks
Over time, your Chart of Accounts may become cluttered with unused or unnecessary accounts, and you may need to clean it up. Follow the steps below to clean up the Chart of Accounts:
Log in to QuickBooks Online and select the Gear icon on the top right corner.
Select "Chart of Accounts" under the "Your Company" section.
Find the accounts that are no longer in use and select them.
Click the “Make Inactive” or "Delete" button to remove the accounts from the chart.
How do I export the Chart of Accounts from QuickBooks into Excel?
If you need to analyze your Chart of Accounts data or share it with others, you can export it from QuickBooks into Excel. Here’s how:
Log in to QuickBooks Online and select the Gear icon on the top right corner.
Select "Chart of Accounts" under the "Your Company" section.
Click the "Export" button in the top right corner.
Follow the prompts to select a format, such as Excel or CSV, and download the file.
Optimize your QuickBooks workflow with SaasAnt Transactions, effortlessly streamlining the bulk import and management of transactions. Enjoy the flexibility to import data seamlessly from diverse formats, including CSV, Excel, PDF, or IIF, simplifying and enhancing your financial processes.
Understanding Chart of Accounts in Bookkeeping
Terms of Bookkeeping
Bookkeeping is the process of recording and organizing a business's financial transactions. It systematically records all financial activities to ensure accurate and reliable financial information is available to the business owner.
Here are some essential terms to understand in bookkeeping:
1. Accounts: Accounts are the individual records of all financial transactions in a business. Each account represents a specific type of transaction.
2. Journal: A journal is the first step in the bookkeeping process. It records every financial transaction of a business in chronological order.
3. Ledger: A book or computer file containing accounts.
4. Debit: A debit is an entry on the left side of an account, indicating an increase in assets, expenses, or dividends and a decrease in liabilities, equity, or revenue.
5. Credit: A credit is an entry made on the right side of an account, indicating an increase in liabilities, equity, or revenue and a decrease in assets, expenses, or dividends.
Chart of Accounts Debits and Credits
A Chart of Accounts is an essential tool in bookkeeping, and it helps a business record its financial transactions accurately. It is crucial to have a thorough understanding of the terms and concepts involved in a Chart of Accounts’ debits and credits. Here are some more detailed points to consider:
1. Debit and credit entries: Record each transaction as a debit or credit entry in a Chart of Accounts. The total amount of debits must always equal the total amount of credits.
2. Debits increase and credits decrease certain accounts: In a Chart of Accounts, debit entries increase asset and expense accounts, while credit entries increase liability, equity, and revenue accounts.
3. Double-entry bookkeeping: Every transaction in a Chart of Accounts must have at least two, with one debit entry and one credit entry. It is known as double-entry bookkeeping.
4. Balance sheet accounts: Balance sheet accounts have two sides: debit and credit. The left side (debit) lists assets, such as cash and inventory, while the right side (credit) lists liabilities and equity, such as accounts payable and owner's equity.
5. Income statement accounts: Income statement accounts have only one side, either debit or credit, depending on the account type. For example, revenue accounts are credit accounts, while expense accounts are debit accounts.
6. Accounting equation: Accounting is a fundamental concept in bookkeeping that shows how assets, liabilities, and equity are related. The equation is Assets = Liabilities + Equity.
In Which Order are the accounts listed in the Chart of Accounts?
Accounts are listed in Assets, Revenue, Equity, Liabilities, and Expenses order in a Chart of Accounts. The order of listing accounts in a Chart of Accounts is vital because it provides a logical structure for the accounting system, making it easier for users to understand and analyze financial information.
Here are some reasons why the order of listing accounts matters:
Consistency: By following a standard order of accounts, companies can ensure that their financial reports are consistent and can be easily compared across different periods or with those of other companies.
Efficiency: A well-organized Chart of Accounts allows for efficient data entry and financial reporting. It minimizes errors, reduces the risk of omissions and duplication, and improves the accuracy of financial statements.
Compliance: Many accounting standards and regulations require companies to use a specific order of accounts or to report financial information in a particular format. Companies can ensure compliance with these regulations by following a standard order of accounts.
Analysis: A well-organized Chart of Accounts allows for better financial analysis. For example, grouping similar accounts can help identify trends and patterns in financial data and make identifying areas for cost savings easier.
In the Chart of Accounts, are the balance sheet accounts typically listed in which order?
Balance sheet accounts are listed in the Chart of Accounts in order of liquidity, with the most liquid accounts listed first. Liquidity refers to how easily a business can convert an asset into cash. Here is the typical order in which balance sheet accounts are listed:
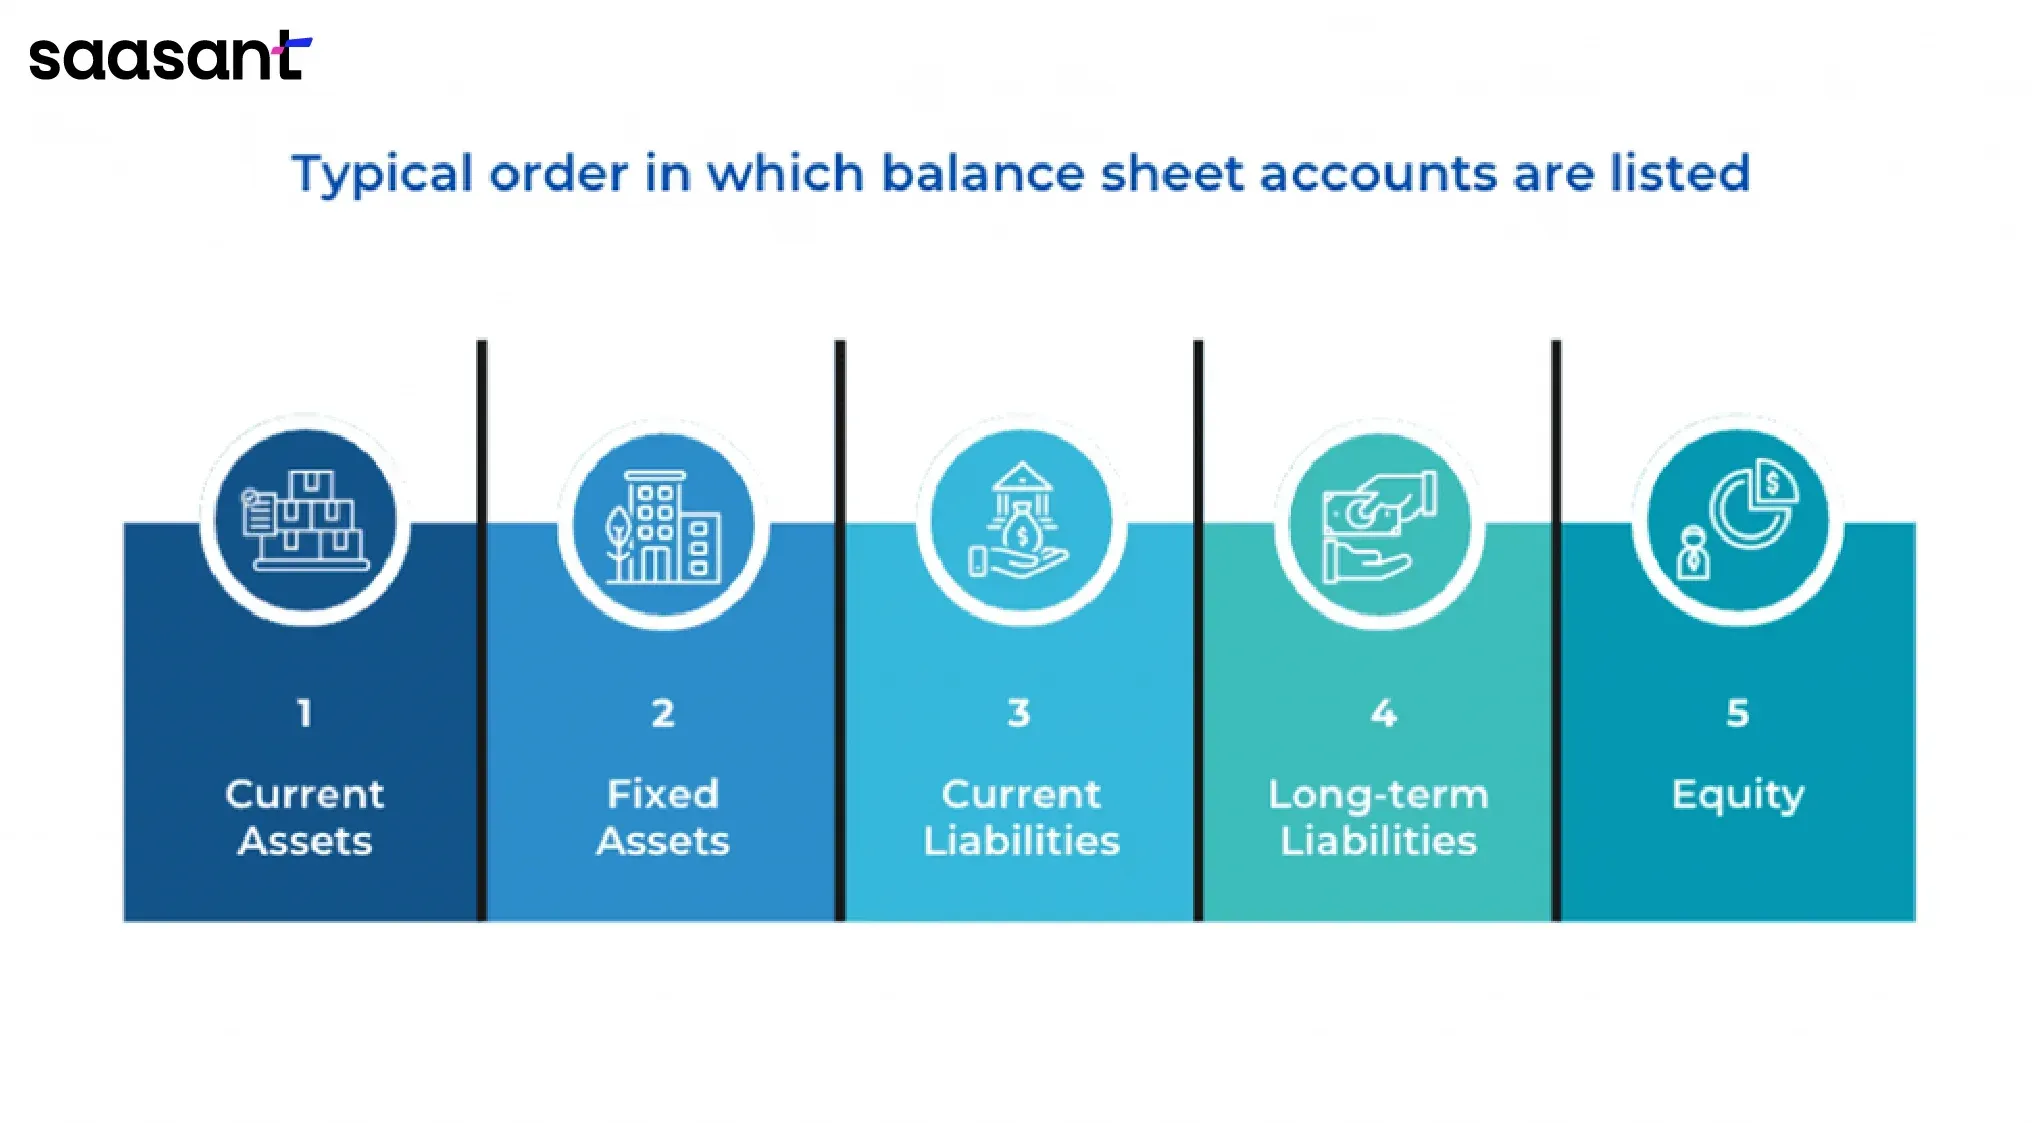
Current assets: Accounts with assets expected to be converted into cash within a year, such as cash, accounts receivable, and inventory.
Fixed assets: Assets like buildings and equipment are not expected to be converted into cash within a year.
Current liabilities: Accounts with liabilities due within a year, such as accounts payable and short-term loans.
Long-term liabilities: Liabilities due in more than a year, such as mortgages and long-term loans.
Equity: Accounts represent the value of the business, such as owner's equity and retained earnings.
Final Thoughts
Managing a Chart of Accounts in QuickBooks is essential for small businesses to ensure accurate financial tracking and reporting. Companies can gain valuable insights into their financial health and make informed decisions to drive growth and success by properly setting up and maintaining a Chart of Accounts.
SaasAnt Transactions is an application that provides an efficient way to import, export, and delete transactions in QuickBooks. These applications can help businesses quickly import financial details into their accounting software such as QuickBooks or Xero.
FAQs
What are the seven basic accounting categories?
The seven basic accounting categories are:
Assets: Resources owned by a company that have monetary value and are expected to provide future economic benefits.
Liabilities: A company owes obligations to other parties, such as loans or accounts payable.
Equity: The residual interest in a company's assets after deducting liabilities.
Revenue: The income a company earns through normal business operations, such as sales revenue.
Expenses: The costs incurred by a company to generate revenue, such as salaries, rent, and utilities.
Gains: Increases in equity resulting from non-operating activities, such as the sale of an asset.
Losses: Decreases in equity resulting from non-operating activities, such as a natural disaster or theft loss.
What are the six accounting standards?
There are several accounting standards used around the world, but here are six commonly recognized ones:
Generally Accepted Accounting Principles (GAAP): It is used primarily in the United States; GAAP provides guidelines for financial reporting in various industries.
International Financial Reporting Standards (IFRS): IFRS provides a standardized framework for financial reporting and is used by many countries worldwide.
Accounting Standards for Private Enterprises (ASPE): Predominant in Canada, ASPE guides private enterprises on financial reporting.
Chinese Accounting Standards (CAS)
Indian Accounting Standards (Ind AS)
Japanese Generally Accepted Accounting Principles (JGAAP)
How do I create a Chart of Accounts in Excel?
Creating a Chart of Accounts in Excel can be a straightforward process if you follow these steps:
1. Open a new Excel workbook and create a new sheet for your Chart of Accounts.
2. Decide the categories and subcategories you want to include in your Chart of Accounts. It will depend on the nature of your business and the accounting standards you follow.
3. In the first row of the sheet, create headers for the following columns: Account Name, Account Number, Account Type, and Description.
4. In the Account Name column, list the name of each account in your Chart of Accounts.
5. In the Account Number column, assign a unique code or number to each account. It will help you organize and sort your accounts later.
6. In the Account Type column, indicate whether each account is an asset, liability, equity, revenue, or expense account.
7. In the Description column, briefly describe each account.
8. Add any additional columns that you need to include in your Chart of Accounts, such as a column for the current balance of each account.
9. Save your Chart of Accounts as an Excel file.
10. Use your Chart of Accounts to organize and track your financial transactions in Excel.
You can create additional sheets in your workbook for your balance sheet, income statement, and other financial reports and use formulas and functions to automate calculations and analyses.
What is the standard Chart of Accounts in SAP?
SAP is a widely used enterprise resource planning (ERP) software that offers various modules to manage different aspects of a business. The Chart of Accounts in SAP is highly customizable, and companies can tailor it to their specific needs.
However, SAP provides a standard Chart of Accounts template as a starting point.
The SAP standard Chart of Accounts includes the following components:
1. Assets
2. Liabilities
3. Equity
4. Revenues
5. Cost of sales
6. Expenses
7. Special G/L Transactions
Each component comprises a predefined set of accounts that companies can modify to suit their needs. For example, the Assets component includes sub-components such as cash, accounts receivable, and inventory, while the Liabilities component includes sub-components such as accounts payable and loans.
SAP also allows companies to define additional accounts or sub-components as needed. The Chart of Accounts can be customized through the SAP transaction code "OB13".
What are the Chart of Accounts expense categories?
The Chart of Accounts expense categories vary depending on the industry, company size, and accounting needs. However, here are some common categories that might appear in a Chart of Accounts:
1. Salaries and wages: This includes all employee compensation, salaries, bonuses, and payroll taxes.
2. Rent: All costs associated with leasing or renting an office or other business space.
3. Utilities: Expenses for electricity, water, gas, and other services necessary to keep the business running.
4. Office supplies: Expenses for paper, pens, staples, printer ink, and other items necessary for daily operations.
5. Advertising and promotion: Expenses for advertising, marketing campaigns, and other promotional activities.
6. Insurance: Expenses for insurance policies, such as property insurance, liability insurance, and worker's compensation insurance.
7. Travel and entertainment: Travel, lodging, meals, and other expenses incurred while conducting business.
8. Repairs and maintenance: Expenses for repairing and maintaining buildings, equipment, and vehicles used in the business.
9. Taxes: All taxes paid by the business, such as sales tax, property tax, and income tax.
10. Depreciation and amortization: Expenses associated with the depreciation of fixed assets and the amortization of intangible assets.
List of accounts used by business
It may vary depending on the industry, company size, and accounting method. However, here are some common accounts that may be found in a Chart of Accounts:
Assets
Cash
Accounts receivable
Inventory
Prepaid expenses
Property, plant, and equipment
Intangible assets
Liabilities
Accounts payable
Accrued expenses
Loans payable
Taxes payable
Unearned revenue
Equity
Owner's equity
Retained earnings
Revenue
Sales revenue
Service revenue
Rental revenue
Interest revenue
Expenses
Cost of goods sold
Rent expense
Salaries and wages expense
Advertising expense
Depreciation expense
Interest expense
Note that this is not a comprehensive list; a specific business may have additional accounts based on their needs.
What are account numbers/codes for in the Chart of Accounts?
Account numbers/codes in a Chart of Accounts serve as a unique identifier for each account. They are used to organize accounts systematically and logically, making it easier to find and reference specific accounts.
The numbering system can vary depending on the company's preference but generally follows a standard convention. Having account numbers/codes also helps ensure accurate and efficient data entry and simplifies the process of generating financial reports.
Why is a Chart of Accounts Important?
A Chart of Accounts is a crucial component of a business's accounting system because it provides structure and consistency to financial reporting. It allows businesses to accurately record and report financial transactions, which is essential for making informed business decisions.
Moreover, a Chart of Accounts is a communication tool between a business and its stakeholders. It provides a clear and concise overview of the business's financial health and enables stakeholders to make informed decisions about investing, lending, or partnering with the company.
Which four statements about the Chart of Accounts are true?
Four factual statements about the Chart of Accounts are:
1. The Chart of Accounts lists a business's accounts to record its financial transactions.
2. Each account has a name and a number for identification purposes.
3. The accounts are typically listed in a specific order, starting with assets, followed by liabilities, equity, revenue, and expenses.
4. The Chart of Accounts is a crucial tool for organizing and tracking financial data and helps ensure accurate financial reporting.
Also read:
Tags
Read also
How to Export Transactions from QuickBooks Online
How to Edit Multiple Transactions in QuickBooks
Batch Transactions in QuickBooks Online - Detailed Guide
How to convert PDF to CSV Files for Accounting